Driving to my family-in-law Christmas dinner, we had Sky Radio playing. My wife cheered, as Mariah Carey’s classic All I Want For Christmas Is You played. Just a song you have to hear this time of year, she claimed, a song that cannot be missed. I, on the other hand, couldn’t help but feel a sense of déjà vu. It had been playing so many times before.
So I decided to test if my feeling was right: that Sky Radio, as Christmas Station, had a few favorites that it kept playing over and over.
I was right. Songs playing 8 or 9 times a day were no exception. Multiple songs playing at least 5 times every day for an entire month. But mostly the fact that every day was basically a repetition of the last one: the first weeks of November played almost 5 times more songs than the same period in December!
Methodology: the source of the data for all charts and tables is Muziekweb.nl, which was scraped automatically. Full code can be found on GitHub.
There’s too few Christmas songs: no diversity in daily playlists
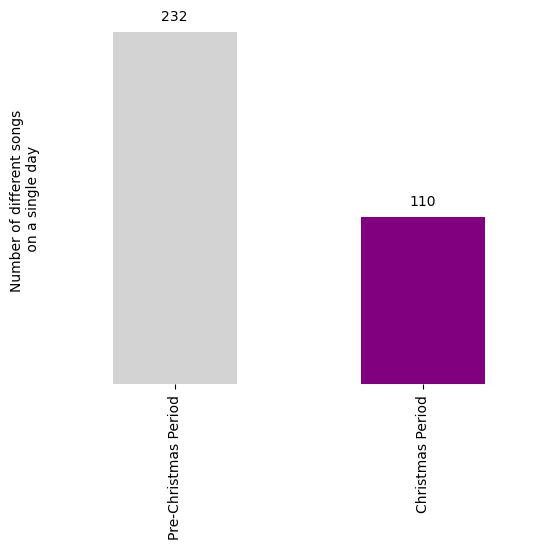
Entering December, Sky Radio only plays Christmas songs. And this leads to the repetitions I mentioned before. For instance, on the first day of December, 110 different songs were on the radio. More than twice that number of unique songs played on the first day of November.
Sky Radio has double the diversity on a single day before it becomes the Christmas Station.
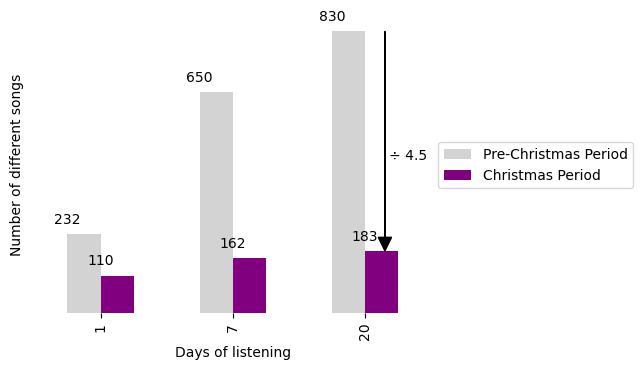
But it gets more repetitive. Look at the same chart, but now for longer periods too: a single day, a week and 20 days of November and December. During the Christmas Period, after listening for a day, you will not hear many new songs anymore: while having heard 110 unique songs on the first day, in the following 19 days you will only hear 73 new songs. This is in contrast to the pre-Christmas period, where you will hear over 600 new songs in these days. This shows fundamentally in the last two bars, where there was 4.5 times less diversity during the Christmas station than before.
Sky Radio plays very few new songs after the first day, playing 4.5 less diverse in 20 days of the Christmas Station than the previous month
The true classics play every few hours for all of December
Speaking of repetitions: some songs are on every day, multiple times. In fact, 9 (!) songs are played every day, at least 5 times, for 25 days straight.
Artist
Title
Mariah Carey
All I want for Christmas is you
Chris Rea
Driving home for Christmas
John Lennon
Happy Xmas (War is over)
Darlene Love
All alone on Christmas
Ariana Grande
Santa tell me
Band Aid
Do they know it’s Christmas
Kelly Clarkson
Underneath the tree
Wham!
Last Christmas
Bryan Adams
Christmas time
Songs played on Sky Radio at least 5 times each day between 1 December 2022 and 25 December 2022
In fact, 4 of these songs were so popular they were played 9 times on a single day!
Artist
Title
Ariana Grande
Santa tell me
Chris Rea
Driving home for Christmas
Kelly Clarkson
Underneath the tree
Wham!
Last Christmas
Songs played at least 9 times on a single day between 1 December 2022 and 25 December 2022
Mind you, this is unique to Christmas. There is no song that comes close to being played this often before. The same goes for the first list: no song was played 5 times every day in November
The ultimate Sky Radio favourites: 12 songs playing for 25% of the time
Just 12 songs, a short CD, account for 25% of the songs played of Sky Radio in December.
Artist
Title
Times played in December
Mariah Carey
All I want for Christmas is you
177
Wham!
Last Christmas
176
Chris Rea
Driving home for Christmas
174
Ariana Grande
Santa tell me
174
Darlene Love
All alone on Christmas
173
Kelly Clarkson
Underneath the tree
173
Bryan Adams
Christmas time
172
Band Aid
Do they know it’s Christmas
171
Queen
Thank God it’s Christmas
165
John Lennon
Happy Xmas (War is over)
163
Dana
It’s gonna be a cold cold Christmas
162
José Feliciano
Feliz Navidad
148
Our conversation in the car continued. While I was saying how I wanted to hear some fresh and exciting songs, my wife was emphasizing how it gave her the real Christmas feeling to hear these classics again, and made her really enthusiastic about the Christmas period. Is repetition a bad thing? Definitely not. They claim to have over 6 million listeners during the Christmas period. Sky Radio for a day is fine. An entire month though? Not for me!
The Top 2000 is a yearly all-time ranking of songs published by Dutch radio broadcaster Radio 2. The ranking gets determined by Dutch voters, who vote over the internet in the first week of December each year. It is a uniquely successful concept for over 20 years now, reaching over 11 million people, or more than 75% of the population and still breaking both listener and voter records almost every year. Because the list has existed for 2 decades now and is an all-time ranking, it is an ideal object to study what contributes to the popularity of a song or artist.
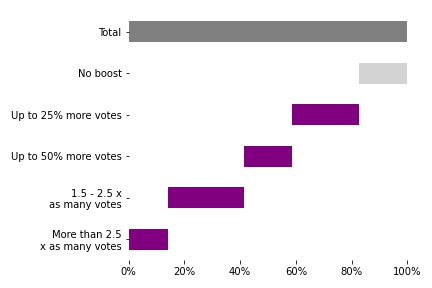
While the list is mostly stable, it has been noted that the passing of an artist has a majorinfluence on the ranking of their songs. It turns out an artist on average gets 80% more votes in the year of passing than in the years before. Over the years, 63 artists who were already ranked in the Top 2000 passed away since the list was first published. While almost all artists get a boost when passing, not all do and even not of those who do all get an equal boost. Michael Jackson, Ramses Shaffy and George Michael all more than tripled their number of votes. On the other hand. Benny Neyman and Ray Charles did not see a noticeable boost. What separates the artists that have major boosts from those who had no boost at all?
Almost all artists get more votes in the year of death than the year before, but the size of the effect differs
I set out to estimate the effects from the historical rankings of the Top 2000. We define a boost as the ratio of the number of votes in the first Top 2000 after the death of the song to the number of votes in the year just before:
To estimate what influences the size of the boost, I downloaded all the yearly rankings. Next, I scraped the wikipedia pages of all the artists, for information such as date and place of birth and death. Unfortunately, Radio 2 does not publish the number of votes, but I estimate these based on a model developed by Peter Meindertsma. Then, I calculate the boost by the equation above. I only calculate this for individual artists, ignoring bands, since I expect differents band member will have very different effects: compare a lead singer to a drummer. That might muddy our estimates. Finally, I develop a Bayesian hierarchical regression model which incorporates both the effect of artist and song characteristics to finally arrive at the parameters of the Top 2000 boost.
The following are the most important conclusions:
An average boost for artist nowadays is approximately 80% extra votes
This boost has been getting much stronger over the years: 60% over the 20 year period
Popularity of the artist is the most important driver for the boost: more popular artists get larger boosts
Artists who pass away shortly before voting starts can expect to have their boost doubled
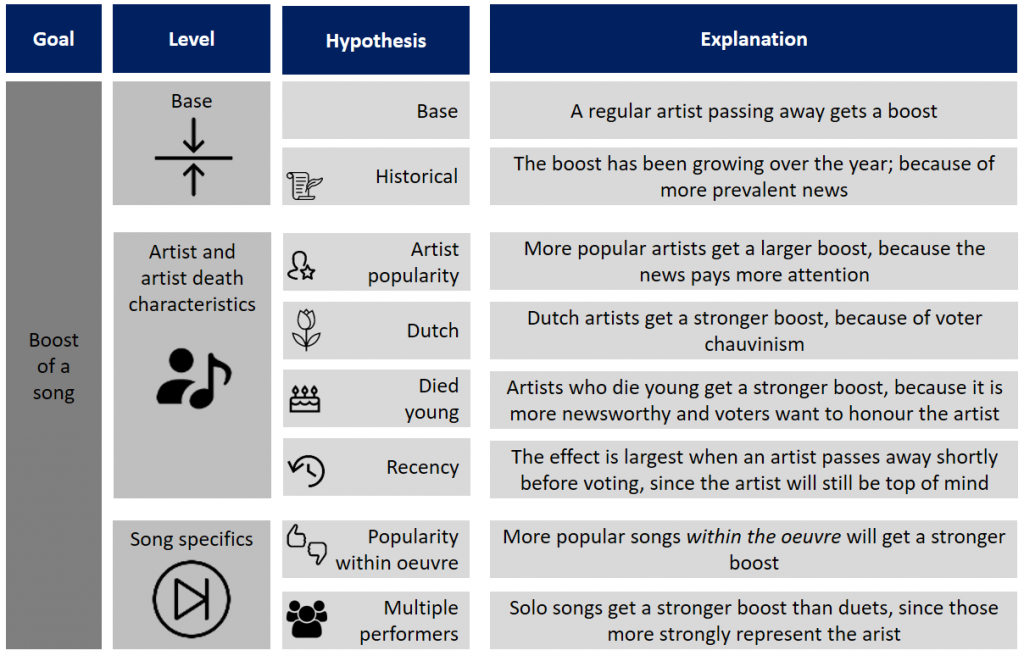
To get a more comprehensive view of the effects, the boost of a song was modeled in 3 steps:
The model estimates a base effect for every artist
Next, the model estimates the deviation for a specific artist from the base effect, based on the characteristics of the artist and his/her death
Finally, the model corrects for how each song is different from the average song for this artist.
For each level, we formulate hypotheses for what influences each level. The hypotheses are shown in Table 1.
Table 1: Hypotheses are formulated for each level, to predict the boost of a song
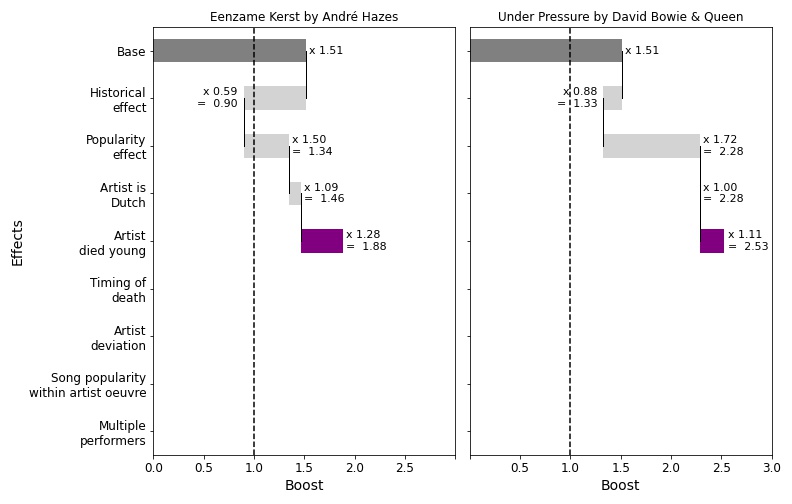
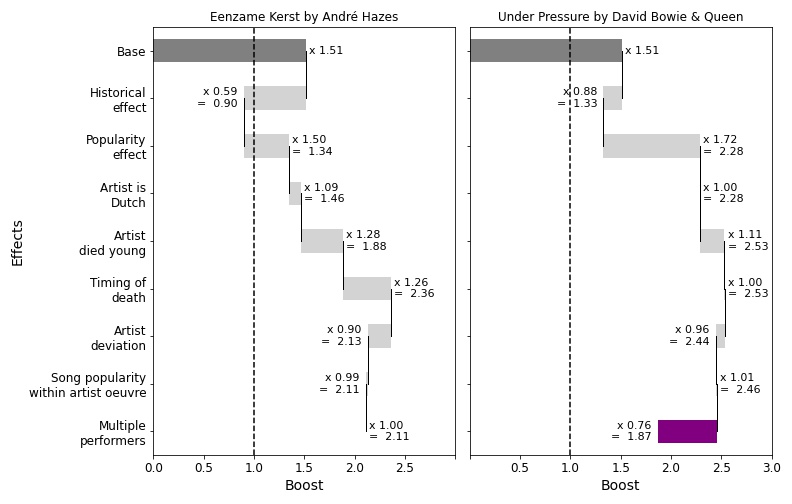
For a more detailed investigation into what affects the number of votes a song gets when the artist passes away, let’s look into two examples and compare why the model predicts a certain boost. All estimates I show below come from the model that was trained to predict the boosts from the full history of the Top 2000. We can investigate each aspect influencing the ranking of a song one by one, and multiply them to get a total prediction for a boost. We will compare Dutch hero André Hazes’s classic Eenzame Kerst, who passed away on September 23, 2004 to Under Pressure by Queen & David Bowie; the latter passed away on January 10, 2016.
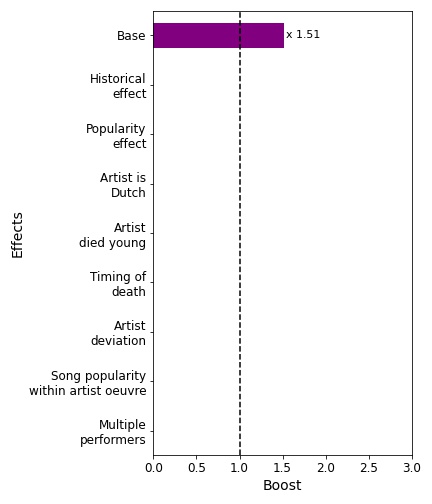
The base effect
The model estimates every songs starts with a boost of 1.51, which means that a completely normal song will get 51% more votes in the year of passing away, than the year before. This is only the base effect; including other effects will (mostly) increase the expected boost.
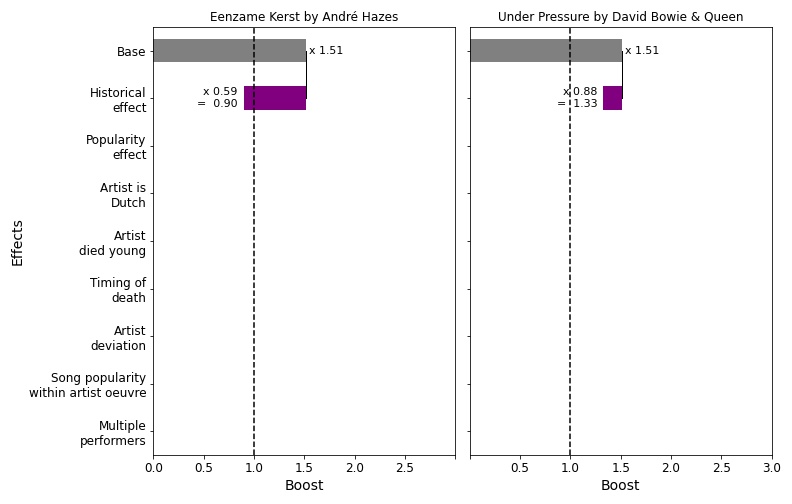
The historical effect: boosts have grown stronger over the years
These boosts have grown stronger over the years, by an amount of approximately 3% per year. This means that the same artist passing away in 2020 would get an almost 60% more votes than an artist passing away in 2000. Presumably, this has everything to do with the way news is being evermore ubiquitous. We see this difference clearly too for André Hazes, who passed away in 2004 when the average artist did not even see a boost but a 10% decrease (but this may very much be compensated for by many other factors, which I will show below), while the average boost in 2016, the year of death for David Bowie was 33%.
André Hazes’s expected boost is lower because he passed earlier (2004) than David Bowie (2016)
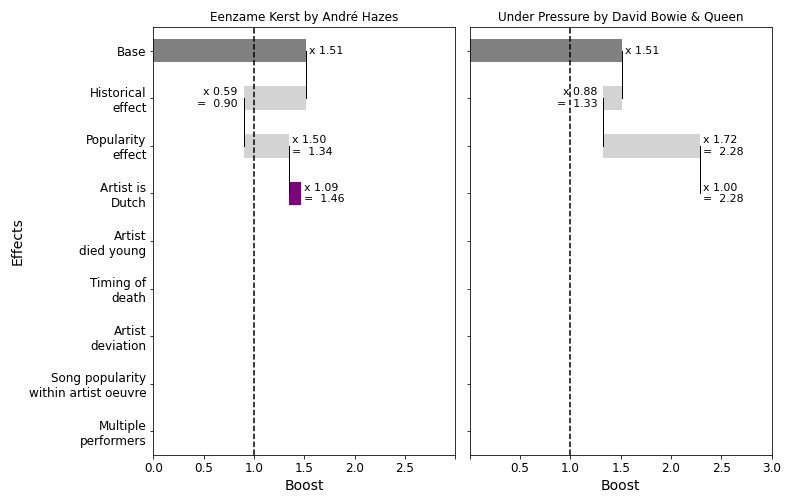
The popularity effect: the more popular you were, the more extra votes you are going to get
When more popular artists die, they get much more news coverage: a relatively unknown artist may get a small article on page 15, while superstars may get entire TV shows devoted to hem. This in turn results in much more prominent boosts for more popular artists. We measure their popularity by the number of votes they got in the year before their death. In the cases at hand, both artist were much more popular than average. In fact, Bowie was ranked 25th in the list of artists with most Top 2000 votes in 2015 (the year before his death) out of 835 ranked artists, or top 3%, while Hazes was ranked 58 out of 975 in 2003. Notice that this effect can be very strong: Hazes gets a 50% boost, but Bowie, by being slightly more popular even gets a 70%+ boost
Bowie gets a stronger boost because he was more popular than Hazes in the respective years before their death
The home game: Dutch artists get a stronger boost
There appears to be some home-game effect; it is not highly significant, nor is it very strong, but still… Dutch artists appear to get a 10% stronger boost; which is were Hazes makes up a bit of ground, since Bowie will not get that
Hazes gets an extra 10% boost because of his Dutch nationality
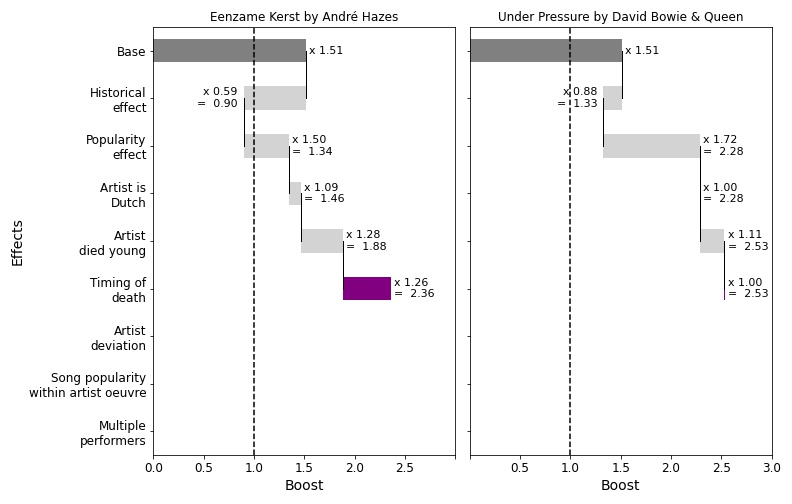
Artist tragedies: the younger you die, the stronger the boost
Newsworthiness does not only depend on the popularity of the artist, but also on the circumstances. Specifically, artists dying young is something that attracts a lot of media attention. Unfortunately, a lot of artists die young. In all the artists we are seeing, we find only 11% lives to the age of 80. We find that artists who pass away at a younger age get a stronger boost. This effect is very strong for artists such as Avicii and Amy Winehouse, who passed away aged 28 and 27 respectively: both gained hundreds of places for multiple songs. There appears to be a 1% stronger boost for every year before age 80. This was the case for both of the artists we are looking into: Bowie passed away days after his 69th birthday (leading to a 11% boost), while Hazes already passed at 53 (leading to a 28% stronger boost).
Andre Hazes gets a stronger boost because he died aged 53, compared to Bowie who passed away at 69.
Short-term-memory: the difference between before the summer and after the summer
It turns out that it matters a lot whether the death is still top of mind when voters start voting, usually in the first week of december. The plot shows that passing away right before the closing votes can get 2.5 times more votes than passing away before the summer.
The boost is much stronger when the artist passes away after the summer, shortly before the voting period
Bowie passed away in January, giving him no extra boost, but Hazes passed away in September. Not super close to the voting period, but still close enough to garner him slightly over 25% extra votes.
Hazes gets a stronger boost for passing somewhat close to the voting period.
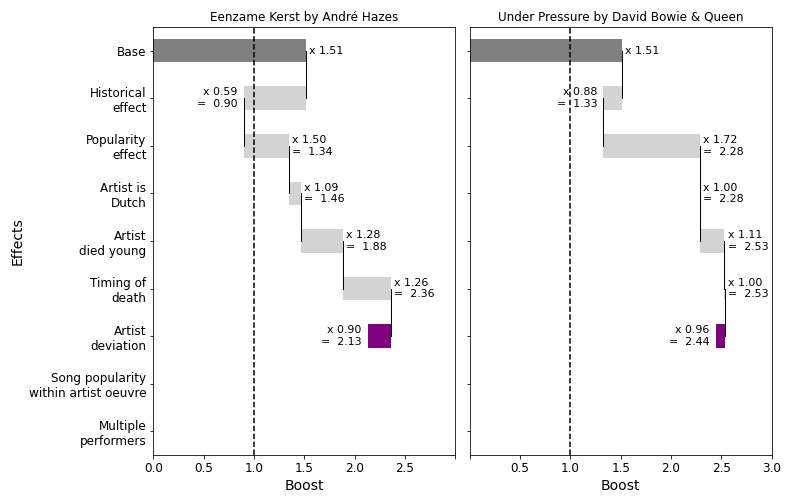
The artist magic: letting the model account for that special something
While there is a lot that is generic, such as the five effects that were just investigated, there is always that special something when it comes to art. The soap surrounding Michael Jackson’s death, for instance. We cannot model all these specifics per se, but we allow the model to account for it, if it has to. While we nudge it into the direction of the explainable effects, by allowing this we decrease the chance it finds spurious relationships and tries to model those through the real effects. This mainly has an effect for artists with many songs, where the group of songs can show it is not something specific to a song, but to an artist oeuvre as a whole. While we cannot use this artist specific deviations to predict future boosts, it can still be useful to make the predictions more robust. In our cases we find a small decrease for André Hazes (more on that later) and a negligible effect for Bowie.
There is something special about Hazes giving him a slightly smaller boost than expected based on his characteristics.
So this concludes the artist boost. We see that Hazes was expected to get 2.13 times as many votes in the year of passing, while Bowie was expected to get 2.44 times as many votes. Interestingly, while the final numbers are quite close, the ways to get there were very different. Hazes dying younger, being Dutch and closer to the voting period, but these effects were offset by dying earlier and being less popular.
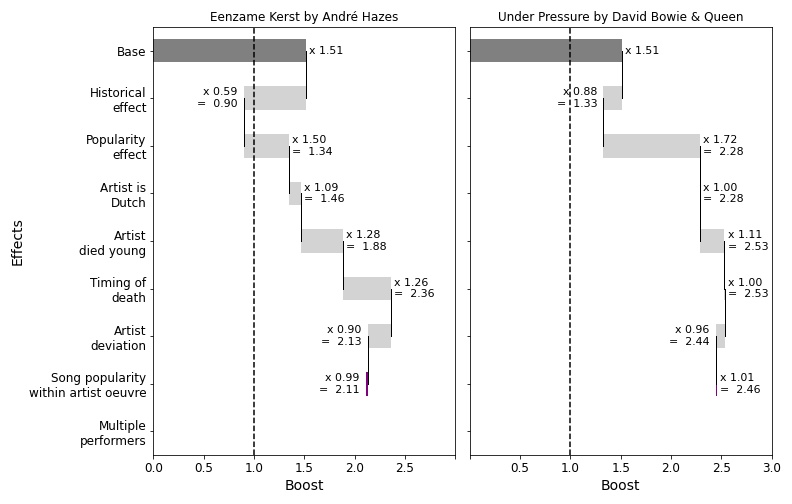
Song popularity: difficult to say which song is going to get a boost
So now that the effects for each artist are known, the final step is to differentiate between songs. First of all, it turns out that the effect of the popularity of this song as compared to the artist’s other songs is negligible:
The popularity of the song within the artist appears to have no effect
Alone is better than together: duets get smaller boosts
On the other hand, there is an effect whether a song is a duet or a solo song. Solo songs by artists who passed away get more of a boost than songs in which they partnered with their colleagues. Some other songs by Bowie got much more of a boost than Under Pressure, for instance. It turns out that songs by multiple performers receive only 75% of the boost on average – which is finally why Hazes’s Eenzame Kerst is expected to get a larger boost than Under Pressure
Since Bowie partnered with Queen for his song, the boost for this specific song is expected to be lower
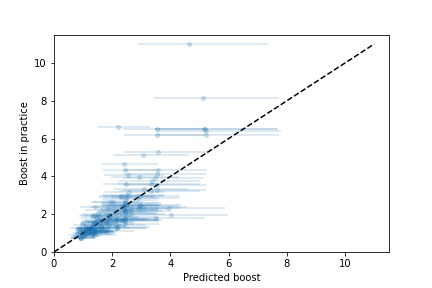
The verdict: predictions match the actual boost very well
It turns out the model does a very good job in predicting these boosts. Eenzame Kerst was predicted to get 2.11 times as many votes, and got 2.12 time as many in practice – well within the margin of error. Under Pressure got 1.98 as many votes, and we predicted 1.87, also very close.
The predictions are very close to the actual boost in the Top 2000.
When looking at what we predict compared to the actual boost, we see the trend is picked up very well and almost all predictions are within the confidence interval.
Predictions match the boost in practice very well
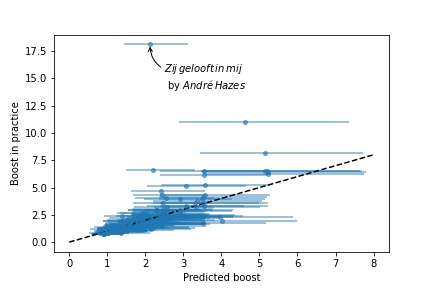
There is only one but… This is not the full figure. There is one song which is completely different from all the other songs:
There is one song that was predicted to have approximately twice as many votes as the year before, but got 18 times as many! And that song was Zij Gelooft In Mij, also by André Hazes. The song was reissued in the year of his death and reached #1 in the Top 40 that year. It was sung at his publicly televised memorial in a sold-out Arena. In fact, this may very well explain why Hazes’s artist boost is 10% smaller than it was expected based on his characteristics: it appears those votes weren’t spread out evenly over his songs, but a lot of them went to Zij Gelooft in Mij.
No artist and no song is the same. Such is music. But what we can say, is that newsworthiness is very important to the ranking of an artist in the Top 2000, and that the circumstances of a death matter a lot. This tells us a lot about human psychology and the news media. But mostly, it tells us that something very tragic, can also lead to much more appreciation of all the beautiful music the artists have made.
The election of the most powerful person on the planet is only 88 days away. The two main contenders could not be more different. Of course with the campaign in full fling, albeit different from other years because of the raging pandemic, everyone wants to know: what direction is the US going to take?
Of course, there are polls, but it appears everybody is ready to read them the way they prefer. Joe Biden is leading, which pleases Democrats, but then of course the polls also had Clinton leading Trump in 2016, and look how that turned out, reply the Republicans. And then there’s the Electoral College which determines the next president, not the popular vote, which may or may not give either party an advantage. That leaves us with enough bickering for a few months.
So what we will do here, is investigate the current polling averages both nationally and per state, and correct for errors that they had historically. This will give us two key race insights:
Joe Biden has a commanding lead
The race is looking very stable
Joe Biden has a commanding lead
While polls show a large 8 point advantage nationally, that is not going to win him the highest office. Instead, we should look at state polling averages. But it is not clear what it tells us that Biden has a 3.5 point advantage in Arizona, with conventions, debates and months of media coverage to go. People may still change their mind and then polls have errors themselves. When looking at the race more thoroughly, we see 3 things:
Biden has a solid lead in enough states to win him the presidency
The national mood would have to swing by up to 6 percentage points to make the race competitive
The Electoral College disadvantage is the Democrat’s largest projected disadvantage in almost 30 years
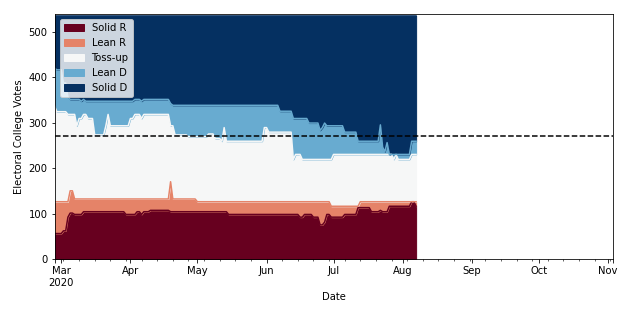
Biden has a solid lead in enough states to win him the presidency
To correct for the uncertainty in the race, we calculated the historical average polling error depending on how many days there are left until the election. We classified a state as Solidly D/R if the party has a chance of winning the state upwards of 90% based on the polling error, and as Leaning D/R if the party has a 2/3 chance on the state; a method we will cover in another blog.
Biden has been steadily increasing his lead so that he now solidly leads in states worth 276 votes
Based on FiveThirtyEight current and historical polling averages and presidential election outcomes since 1980
We see that Joe Biden has been steadily increasing his lead since mid-June, increasing his solid Electoral Votes, with 276 Votes in the Solid category and another 29 Leaning Biden’s way (all from Florida). This is a large advantage over Trump’s 116 Electoral College votes in states that are Solidly Republican, and 10 more in the Leaning Republican category right now. Even the names of the toss-up states (104 votes together) are enough to show that the race is Biden’s to lose: Texas, Ohio, Georgia, North Carolina and Iowa are not only tradionally red, they all went for Trump in 2016, by 3.5 to even 9.5 points.
Indeed, Clinton was only very briefly leading as Biden has been for longer now, and that was immediately after her convention which gave her a polling bounce. It’s important to note that Biden is not experiencing such an artificial polling bump right now.
Clinton’s lead was much more volatile and only as large as Biden’s just after her convention
Based on FiveThirtyEight current and historical polling averages and presidential election outcomes since 1980
Obviously, this does not mean Biden is a shoo-in for president. Something may still completely change the course of the race. And do not confuse the individual probability of a state to vote blue or red with the concerted efforts, since there is a lot of correlation in polling errors. But he does have a bit of slack.
The national mood would have to swing by up to 6 percentage points to make the race competitive
So how much slack does Biden have? For this, we investigate a concept called the tipping-point state. As Wikipedia notes, “the tipping-point state is the closest state that gives the winning candidate 270 or more electoral votes”. The advantage of the winning candidate in that state is the number of percentage points the entire country needs to swing to change the outcome of the election if the partisan lean of every state were to stay the same. In that sense, it’s a much more telling number than the national advantage, which is basically meaningless since there is no national vote. This year, it appears Biden can afford to lose 6 or 7 percentage points, while still winning the election.
Biden has a larger lead in the tipping-point state than Clinton had
Comparing this to Clinton in 2016, we see she shortly had this type of lead, but only immediately after her convention bounce, which (again) was not representative for her actual standing come November.
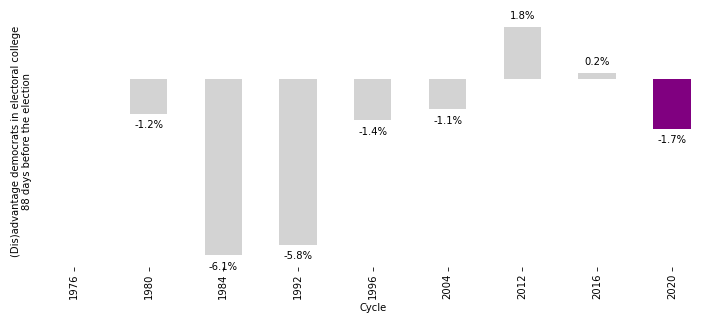
The Electoral College disadvantage is the Democrat’s largest projected disadvantage in almost 30 years
The downside for Biden is that the Electoral College, which cost Clinton her presidency, is looking even more disadvantageous for him that it was for democrats 4 years ago. The 6 percentage points he can lose in the tipping-point state is less than his polling advantage on the national level, meaning he has an Electoral College disadvantage. We can quantify this, by subtracting his national lead from his advantage in the tipping point state. If we compare this to other candidates, he is approximately at a 1.5 point disadvantage. This makes him the most disadvantaged Democrat since 1992. For now, he can bear the weight, but this may change in the future.
The Electoral College is looking historically bad for the Democrats this cycle
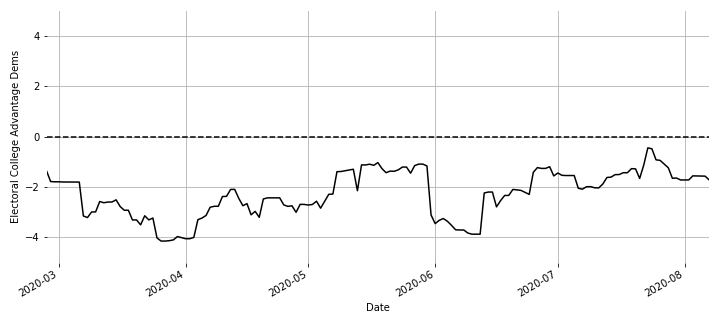
This number may of course still change during the campaign. Indeed, it did for Clinton who was looking at a small advantage at this time 4 years ago, and it cost her her presidency during the election. However, so far this cycle the Electoral College disadvantage for Democrats has been very stable:
The Democrats’ Electoral College disadvantage has been stable in 2020
The 2020 race is historically stable
So we saw Biden’s lead is as large or larger as Clinton had on her peak, immediately following her convention. However, there’s one big difference between the 2020 and 2016 race: Biden’s lead is not only large, it’s largely stable as well.
The 2020 cycle has been one of the most steady races in memory
This cycle has few undecided voters compared to swingier elections
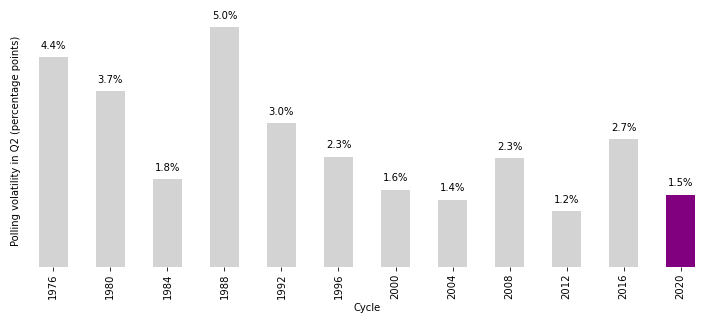
The 2020 cycle has been one of the most steady races in memory
In fact, Biden’s polling lead is one of the most robust in memory. We calculated the root-mean-square error of the polling advantage in the months April, May and June with respect to the polling advantage mean as a measure of the volatility of the race. These months don’t have the party conventions which often add a lot of volatility. The stability this race is third only to the 2004 and 2012 races, both also races with an incumbent and also comfortably won by the polling front runner. It is very different from the 2008 and 2016 races.
The 2020 volatility is close to 2004 and 2012
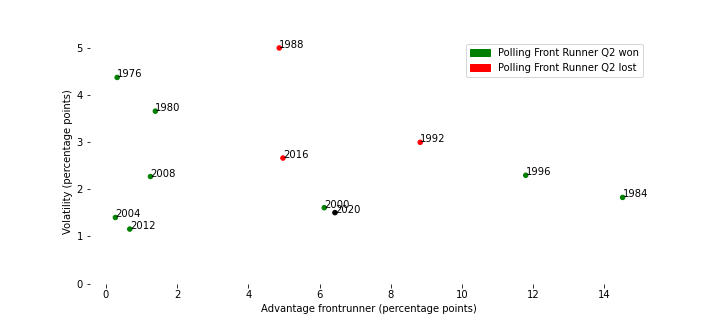
While no candidate has ever lost with an advantage in a race that has such low volatility, there is a cautionary tale:
2020 is also very close to the 2000 race
Biden’s closest match right now in terms of advantage and volatility is… George Bush when he ran in 2000. While he did manage to win, he did so very narrowly and while losing the popular vote, losing a large advantage he had.
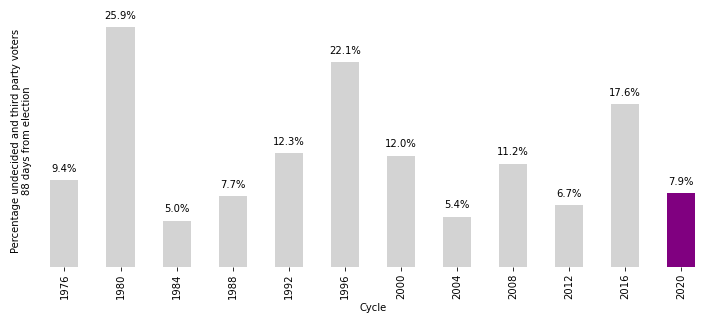
This cycle has few undecided voters compared to swingier elections
But not only is historical volatility low, this race also features very few undecided and third party voters. This leaves much fewer voters for the Trump campaign to convince and is not boding well for future volatility, something he dearly needs.
Volatility has much fewer undecideds than the tight elections in memory
Note how this is much lower than the 2000 race we just saw, and in fact (again) much more comparable to the 2004 and 2008 races. This may be the largest difference between 2016 and 2020: many voters were on the fence at this time 4 years ago, but now, voters have their mind made up.
So Biden has a large and stable lead. Obviously, a lot can still change, especially in the special times we live in now, with a raging pandemic and the Black Lives Matter protests going on. That said, for now, the Biden’s outlook is much rosier than Trump’s .
![\[\textrm{Boost} = \frac{\textrm{Votes in year of passing}}{\textrm{Votes in year before passing}}\]](https://sjoerdcornelissen.com/wp-content/ql-cache/quicklatex.com-92d3dde48d80c675fd95537279e00f41_l3.png "Rendered by QuickLaTeX.com")